The outputs have been done for “SLIM – Sustainable Landscape through Integrated Management” project, co-financed jointly by the European Union (EU) and Czech Development Agency (CzDA). The project’s specific objectives are to strengthen governance mechanisms, policies, and coordination for integrated landscape management, and to enhance technical and technological capacities for integrated landscape management and climate adaptation. The project provides a platform for the application of Czech experience and solutions, in particular the technical and technological transfer of Czech know-how in the use of geospatial data. The programme should also help to make European satellite data, provided free of charge, available to Zambian institutions and train local experts in its effective use in areas such as forestry, agriculture, water management or environmental protection. The results enable informed decision making and the implementation of effective landscape management practices through the collection of accurate and comprehensive data. The outputs (thematic maps) have been done with the main project partner: the National Remote Sensing Centre (NRSC).
The main outputs of the project are the following baseline maps:
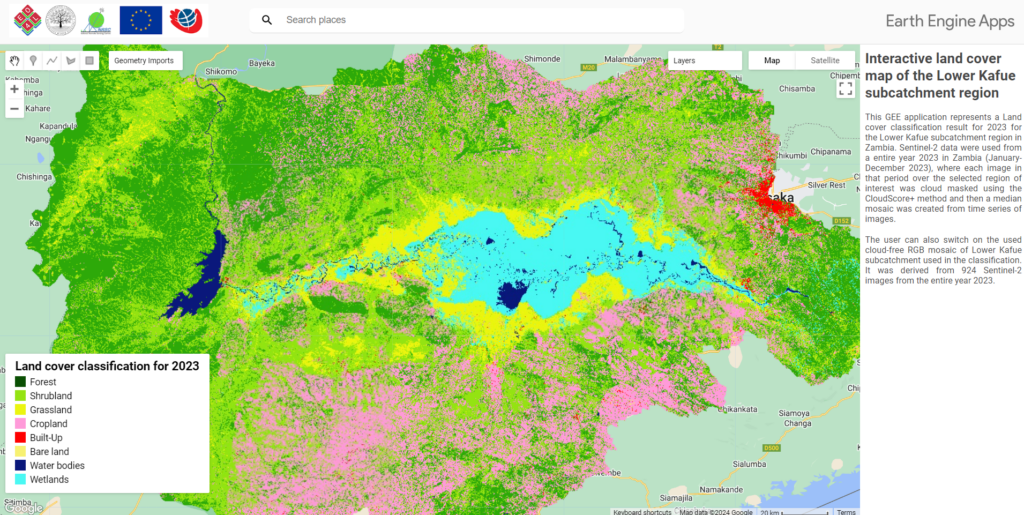
1. Land Cover Map
The main goal of the map was to create an up-to-date land cover map (for year 2023) with the highest possible spatial resolution granted by open-access data (10 metres) and the highest accuracy for the Lower Kafue sub-catchment. A very important methodological step was to draft a legend suitable for Zambia, based on knowledge of local experts (NRSC) and consultations with stakeholders (EU delegation, Forestry department). The Land Cover map was compiled using the approved legend and Google Earth Engine (GEE) cloud-based platform. A semi-automated procedure using open-data (Copernicus data Sentinel-2 and Copernicus DEM) through GEE was utilised.
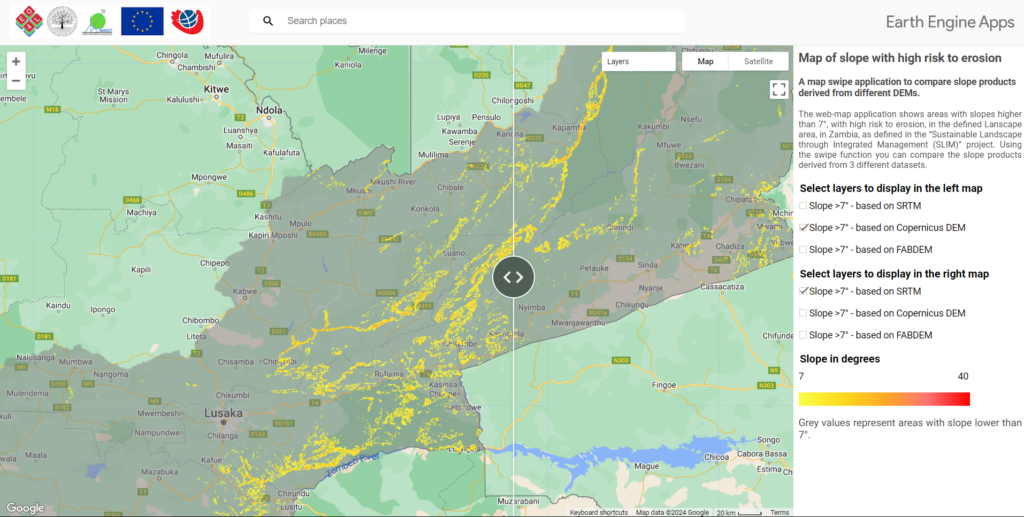
2. Slope Map
The main goal of the map is to provide an online map with erosion risk information derived from slope calculated based on the most detailed and accurate freely available global digital elevation model (DEM). For this reason, the created GEE code detects areas with erosion risk and a comparing slope data derived from different Digital Elevation Models (DEMs) within the defined Landscape area of the SLIM project. A threshold of 7° of slope in erosion risk assessment refers to a criterion used to identify areas that are particularly susceptible to erosion. Output is available in the GEE application on the following link:
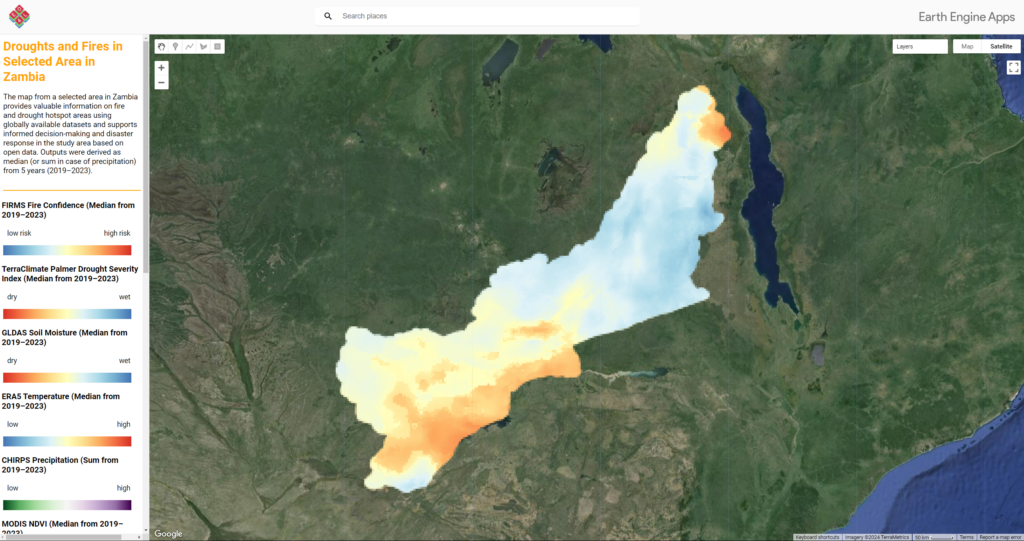
3. Map of hotspot areas of drought and wildfires
The map of hotspot areas is essential for informed decision-making, effective risk reduction, and building resilience in the face of increasingly frequent and severe natural hazards, specifically drought and wildfires. Spatial analysis techniques, such as hotspot analysis or clustering algorithms in GEE were used. The FIRMS (Fire Information for Resource Management System) dataset was used to identify areas with significant occurrences of wildfires for wildfire monitoring. The TerraClimate Palmer Drought Severity Index is implemented for drought monitoring. A median composite was created from all images (one image is available from each day), showing the most frequent fire confidence values for each pixel from all days from the beginning of 2018 to the end of 2023. On-line application is available here.
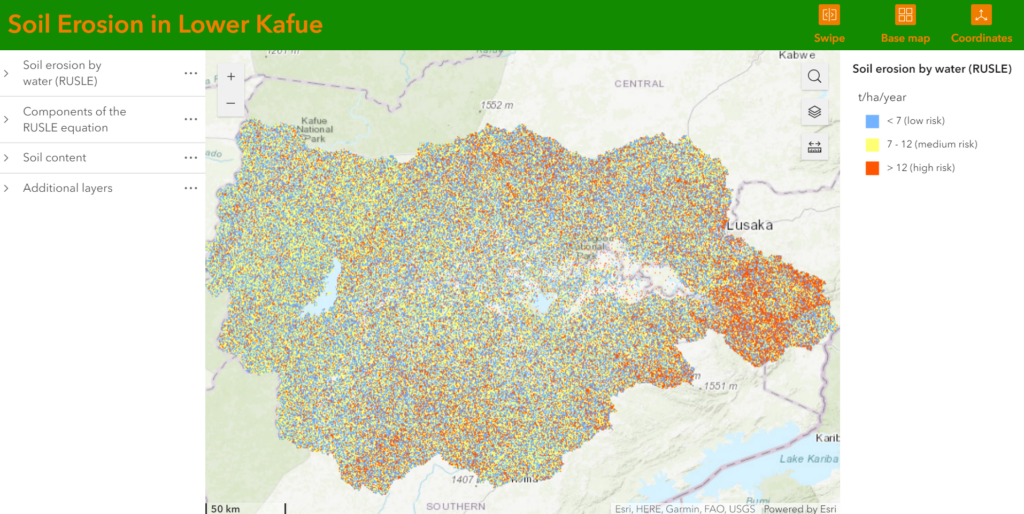
4. Soil degradation map
The map presents results of soil erosion model for Lower Kafue Basin based on the RUSLE (Revised Universal Soil Loss Equation) method. The RUSLE algorithm has been implemented because of its complexity and accuracy. The rainfall, runoff, soil erodibility/erosivity, slope length and slope steepness and land cover are input factors in the model. considered. Classes for low, medium and high erosion risk were adopted from Zambian governmental institutions. Fully interactive online web map is published here:
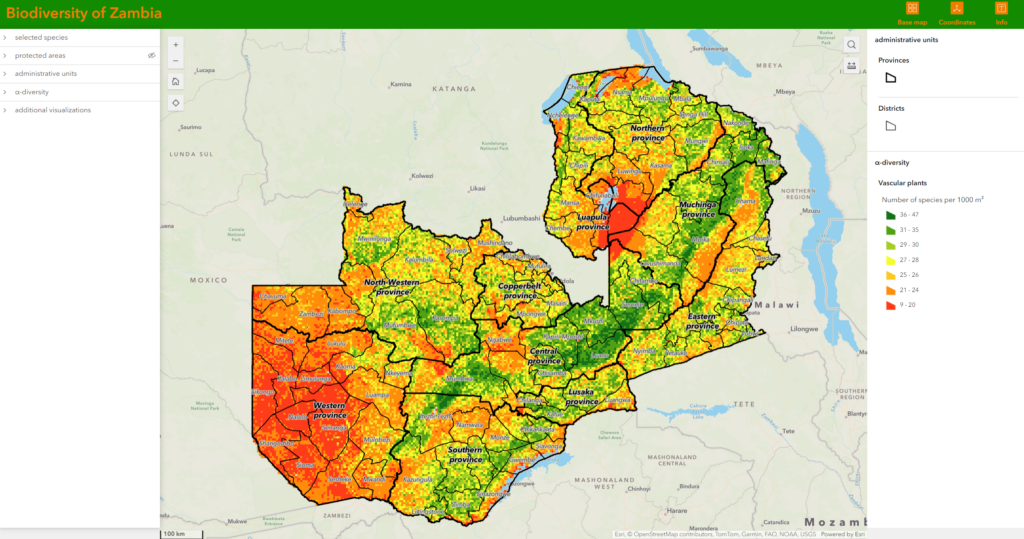
5. Map of Biodiversity and Protected Areas
The main goals of the map is both obtaining the most updated map of protected areas of Zambia and information about biodiversity conservation, combining information on habitat diversity with species distribution data to inform conservation planning, habitat management, and ecosystem protection. The Map with datasets provides valuable insights into the spatial distribution of habitats and species, supporting evidence-based decision-making and action for biodiversity conservation at global and local scales. The map enables interactive visualisation of the layers and a combination of the content with other web-based spatial data mapping services. Map of Life application, data from ESRI Living Atlas and IUCN reflects a complex approach to biodiversity conservation, combining information on habitat diversity with species distribution data. The map are available here: